 While working on our final project Lauren suggested an activity for us to do called Theatre of the Oppressed. It was a big eye opener to me that when we face situations we have many scenes playing out in our heads which is a big part of visual literacy. I struggled a little bit at first trying to figure out how the two fit in, but since visual literacy is the ability to interpret, negotiate, and make meaning from information presented in the form of an image. When we think and are presented with situations we visualize them in some way and from there take further action.
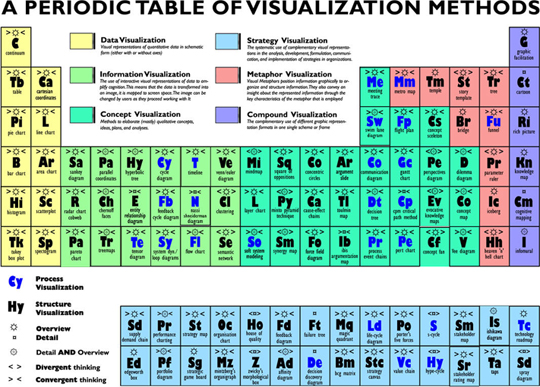
I came across this website that’s a periodic table of visualization methods. It has examples of data, information, concept, strategy, metaphor, and compound visualizations. It would be a great tool for someone to use when trying to figure out how to best represent an idea. By scrolling over each ‘element’ an example would come up with a short overview.
No comments:
Post a Comment